To configure the remote debugging form JDeveloper to Weblgic Server11g
Following are the steps to be followed.
- Enable the debugging in Weblogic Server.
- Configure the JDeveloper for Debugging.
- Start the debugging.
Enable the debugging in Weblogic Server.For Windows System:
Go the startWeblogic.cmd file and add the following debugging parameter.
-Xdebug -Xnoagent -Xrunjdwp:transport=dt_socket,address=4000,server=y,suspend=n to the JAVA_OPTIONS.
For Unix System:
Go the startWeblogic.sh file and add the following debugging parameter.
-Xdebug -Xnoagent -Xrunjdwp:transport=dt_socket,address=4000,server=y,suspend=n to the JAVA_OPTIONS.
i.e.
REMOTE_DEBUG_OPTION=-Xdebug -Xnoagent -Xrunjdwp:transport=dt_socket,address=4000,server=y,suspend=n
JAVA_OPTIONS=$JAVA_OPTIONS: $REMOTE_DEBUG_OPTION
Change the port no You want to use.
Then start the weblogic Server,after that go to server in admin console then enable the tunneling.
Configure the JDeveloper for Debugging.
1) To go to the specific project and open the Project Properties.
2) To select the Run/Debug/Profile page and go for Edit.
3) To click on the Remote Debugging checkbox to enable remote debugging for this run configuration.
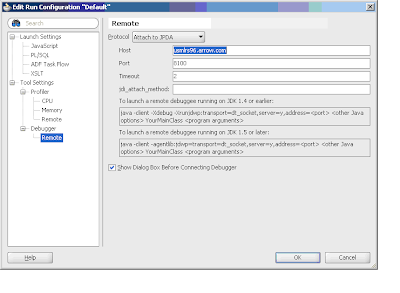
3) To click on the Tool Setting/Debugger/Remote to provide remote server info
Provide host:usmlrs96.arrow.com
Actual debugging of the application
We need to deploy the Application in weblogic server dev box. And put the breakpoint on files you want to debug.
Right-click on the project you want to debug (i.e. AdminUI) and select Start Remote Debugger
f) To verify the attachment details shown in the Attach to JPDA Debugee and click OK to attach to the
remote debugger.
Click O.K and proceed.
Once connection is established you will see the message like.
Start the debugging.
Hit the url of your project want to debug. We will see break point line will be highlighted given by you.
Following are the debug option
To disconnect click on Terminate button and click on Detach button from pop window.


